Copulas - the art of avoiding marginal distributions!
The simplest decision problem is forecasting the value of one variable in terms of another. We will focus on the relationship between stock prices and index prices, usually called a market model, in this blogpost. Our job as academics is to tease out the precise meaning of the word ‘relation’.
Consider an imaginary table of stock price vs index price:
| Stock Price (X) | Index Price (Y) |
|---|---|
| 2 | 45 |
| 2 | 52 |
| 2 | 48 |
| 3 | 52 |
| 3 | 60 |
| 4 | 65 |
| 4 | 68 |
| 4 | 70 |
| 5 | 68 |
| 5 | 75 |
| 5 | 80 |
| 6 | 80 |
How do we find a relation between the two variables?
From Functional Relations to Distributions
The figure below illustrates three types of relationships we can observe:
- Ideally, we would love to get a functional relation $Y=h(X)$, i.e. a unique value of $Y$ for each value of $X$. The economists favorite tool ‘linear regression’ is popular because who doesn’t love functional relations. Linear is easy so it sweetens the pot!
- However, in practice, when we collect data and stare at the table, we usually get multivalued function, i.e. $h(X)$ can be a set of values.
- When sufficient number of data collection experiments are repeated, the data usually has more information: we can keep track of the multiplicity of values. So we get a ‘distribution’!
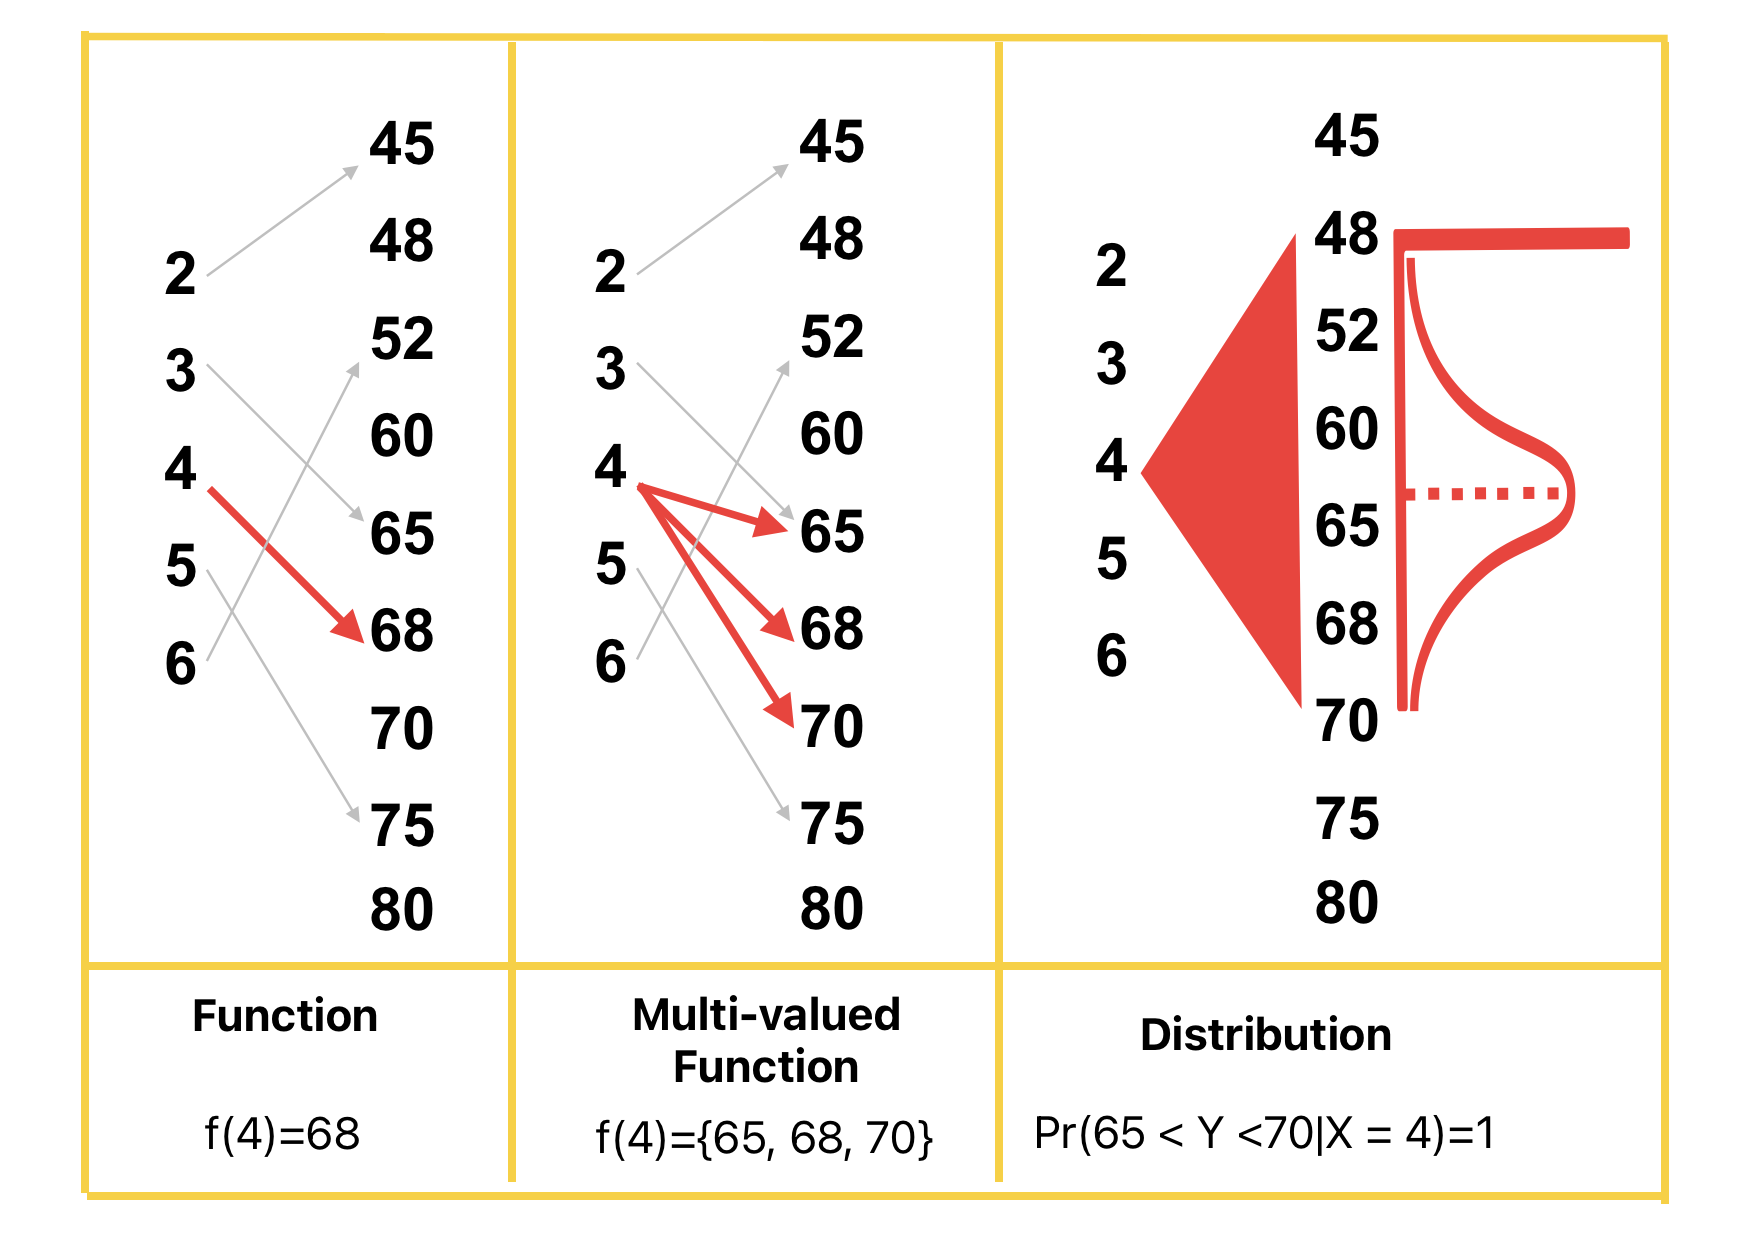
In summary, we may view a conditional distribution $\Pr\{Y=y \mid X=x\}$ as a ‘statistical function’. For every input value of $x$, it gives us a distribution of $y$ values instead of a single value. Traditionally, in probability theory, conditional distributions are computed using joint distributions of $(X,Y)$. Information about the marginal distributions is stored within the joint distribution.
Copulas: Capturing Dependence Without Marginals
The aim of this blogpost is to motivate an interesting form of ‘joint distribution’, called ‘Copula’, that forgets the marginal distribution information! Think of it as analogous to a linear relation after converting both the variables to percentages. So its like a relation between normalized variables.
This becomes especially useful when there is no consensus on the marginal distributions of the variables involved. A good example is the distribution of daily stock returns. These are often assumed to follow a normal distribution, but in reality, large deviations (extreme returns) occur far too frequently for that assumption to hold. Recognizing this, Mandelbrot (in @mandelbrot1963variation) and Fama (in @fama1965behavior) later proposed using Lévy-stable distributions as more appropriate alternatives.
If distribution of returns is controversial, can we study market models independent of such assumptions?
YES! We can use copulas.
The idea of copula is motivated by a cute mathematical observation.
So we have a universal method to transform a random variable with known distribution into a uniform random variable! Now suppose we have two variables $X,Y$ with marginal cdfs $F_X,F_Y$, the joint cdf of the uniform random variables $U_X = F_X(X), U_Y=F_Y(Y)$ is called the copula of $X,Y$ (see @sklar1959).
The copula has the following cool features:
- The copula is a joint distribution of two uniform random variables. The marginal distribution of $X,Y$ is lost and cannot be recovered from the copula.
- If $X,Y$ are independent, then copula $C(u,v) = uv$. If they are completely dependent, say $X=Y$, then $C(u,v) = \text{min}\{u,v\}$. Thus copula still tracks the relation between variables even though the marginal information is lost.
- Sklar’s theorem allows you to build a joint cdf by assembling a copula and a pair of marginal distributions!
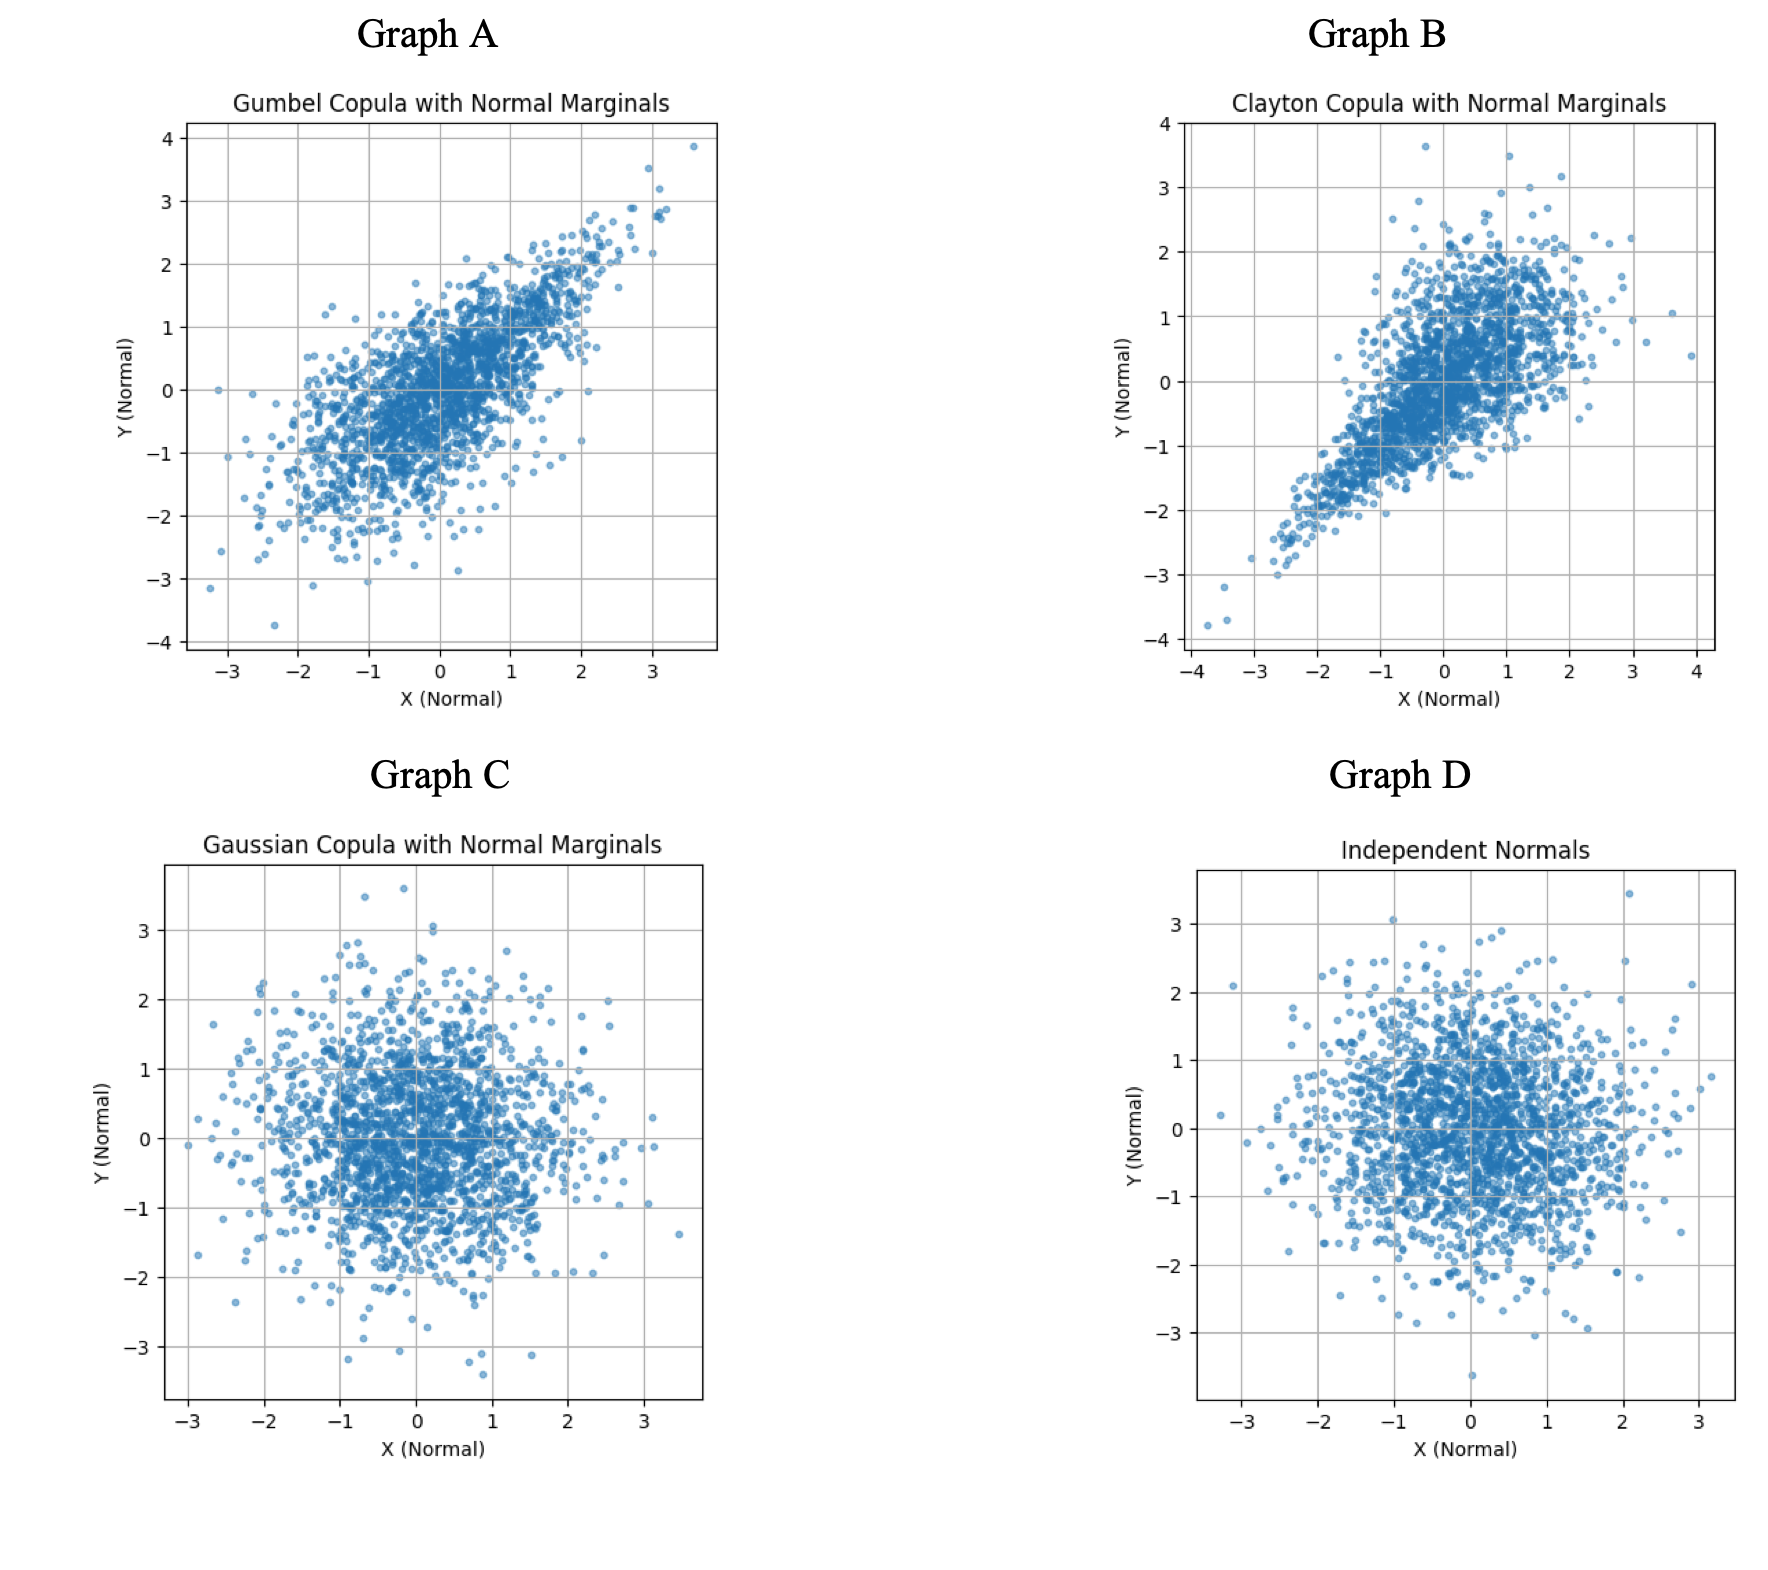
In finance, the controversial question of whether daily returns of stock prices are normally distributed can be side stepped with copulas. We can focus on a copula based market model where we estimate the copula of stock return and index return. The conditional distribution of stock crash given that the market has crashed is called the ‘market crash risk’. Dr. Selarka, my MA student Amritha, and I estimated the market crash risk for Nifty50 and it forms the main part of Amritha’s dissertation. Amritha has written python modules for copula estimation following the ideas in Chabi-Yo et. al. and I leave you with pretty pictures from her dissertation. If you are curious, read it and let us know your comments.
References
Enjoy Reading This Article?
Here are some more articles you might like to read next: